Crypto Tracking app
Crypto tracking helps investors monitor their cryptocurrency investments in one place by providing clear visibility into portfolio value, asset performance, gains, losses, and market movements. It simplifies complex financial information, making it easier for users to understand their investments and make informed decisions.

Self-Initiated UX Case Study
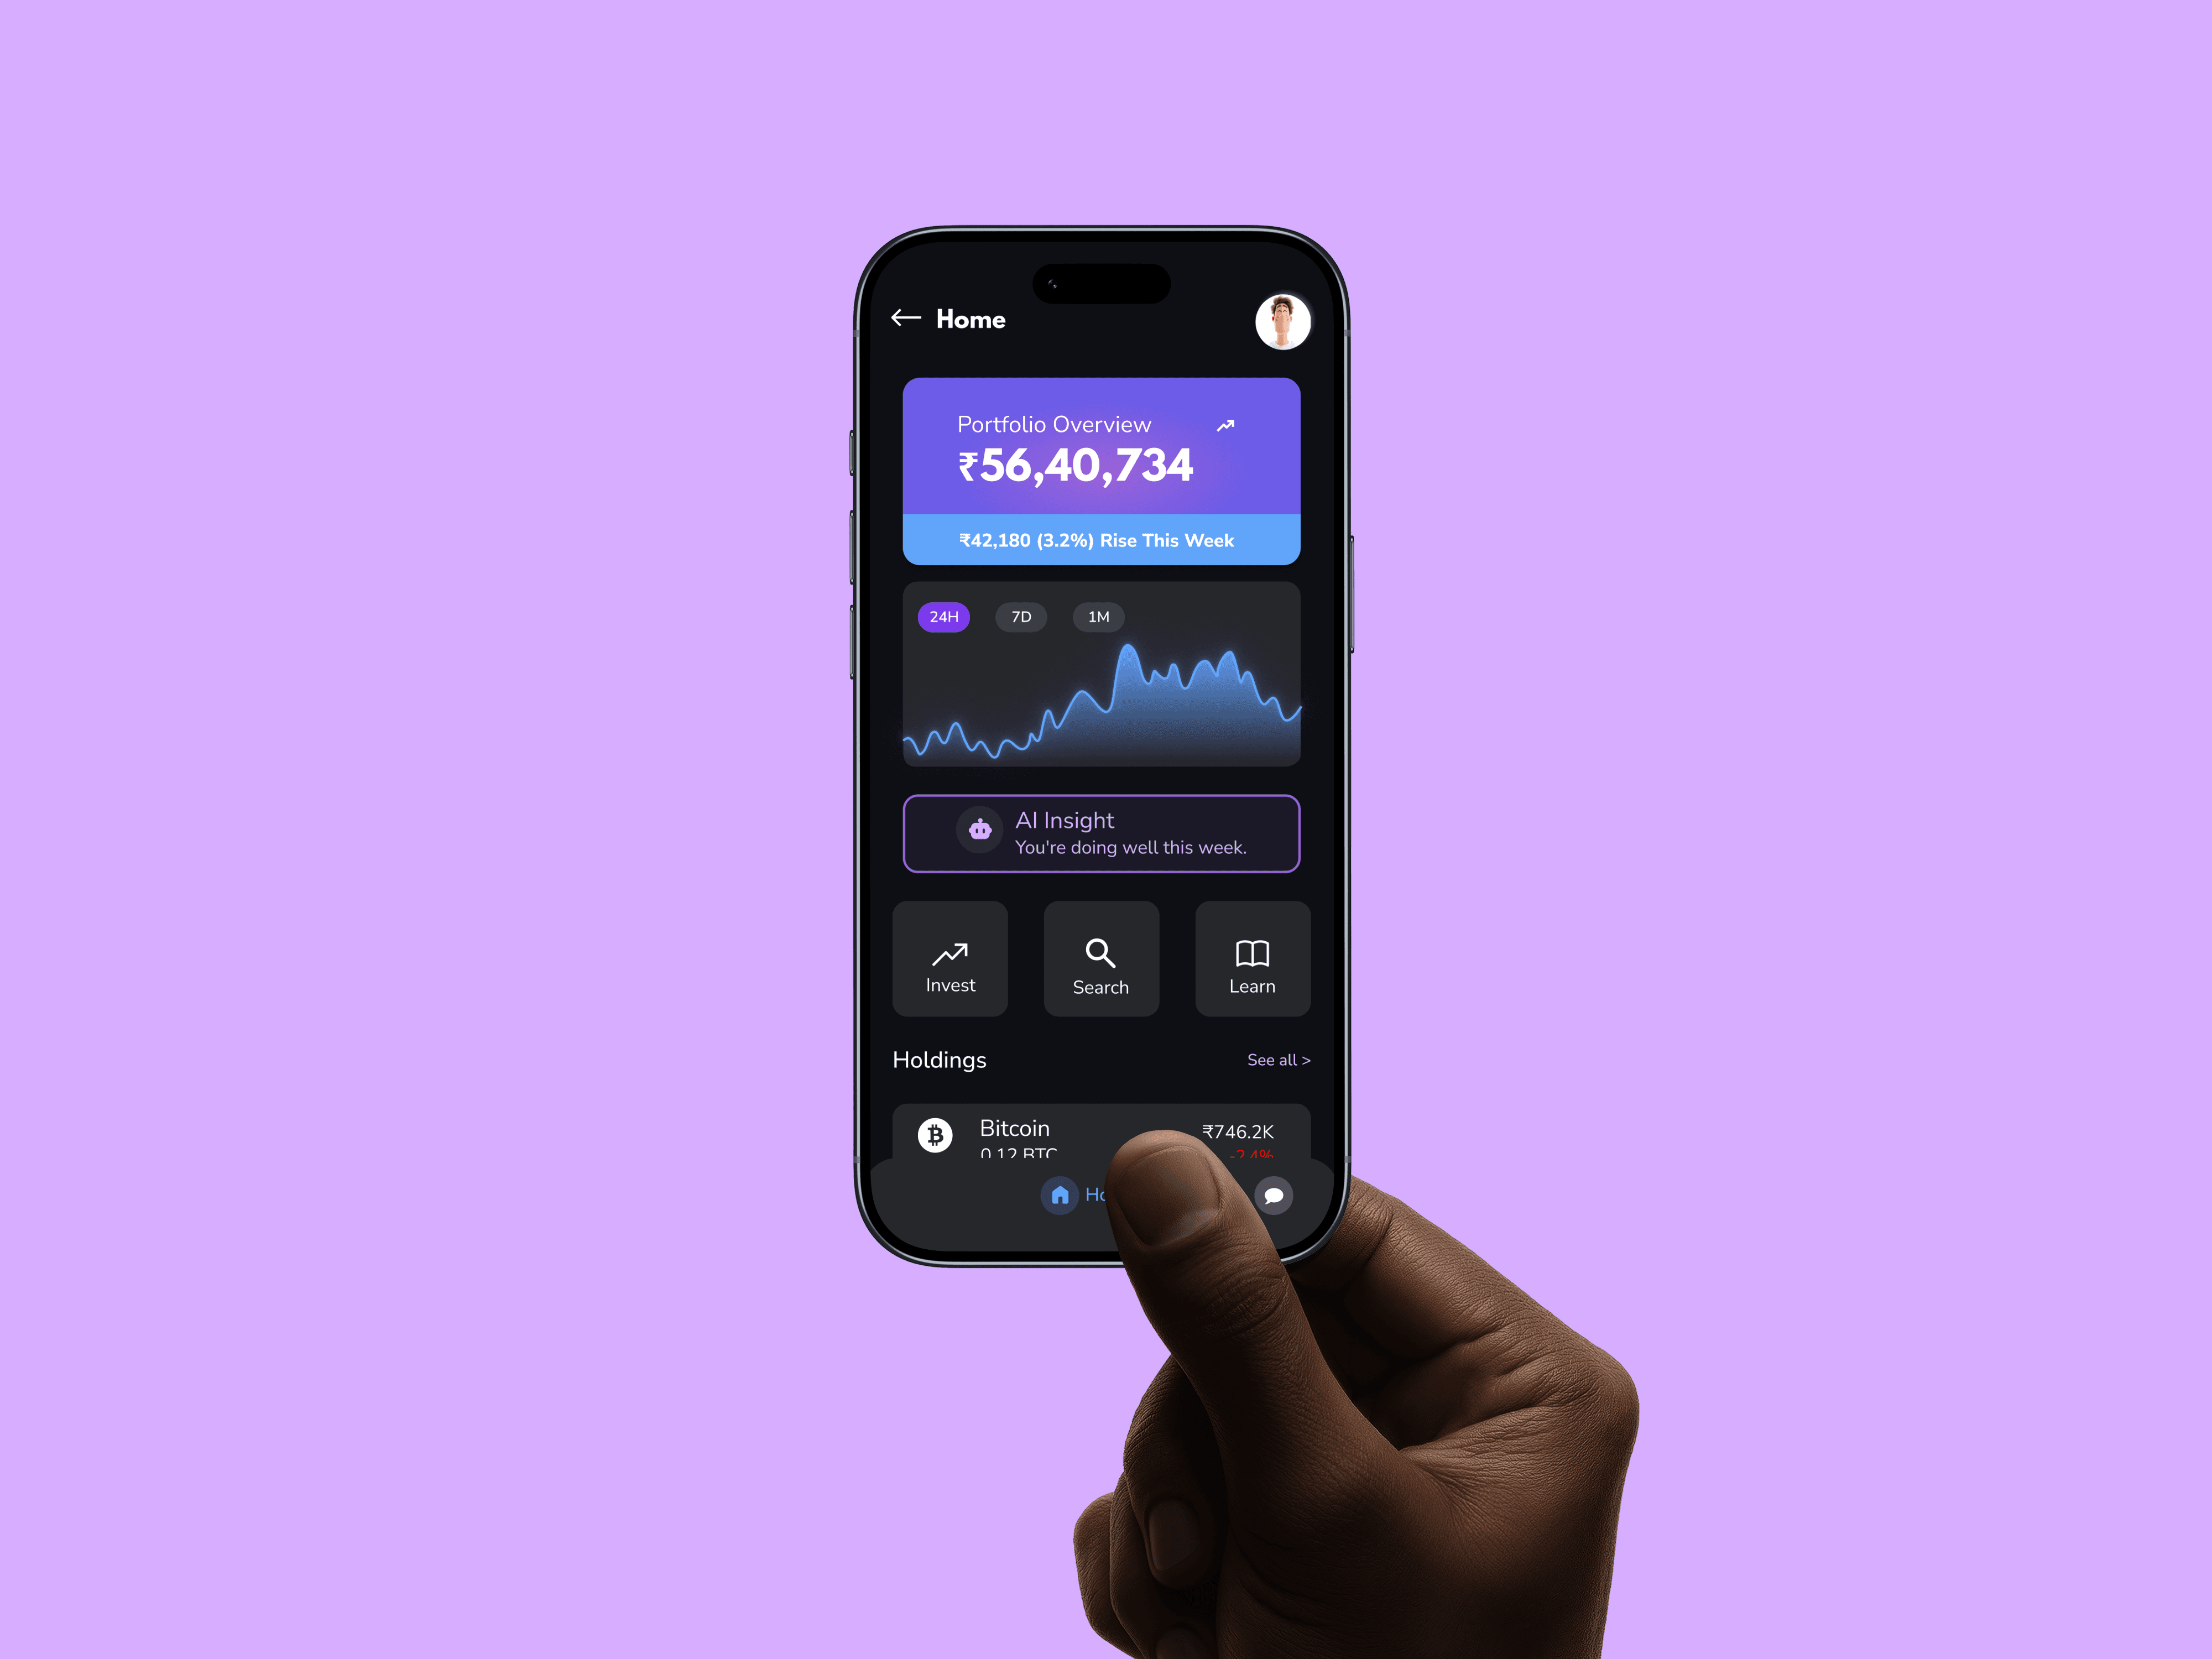
Helping First-Time Investors Understand Their Portfolio
Project Overview

Many first-time investors find it difficult to track and understand their investments due to complex financial information and scattered platforms. This project simplifies portfolio management by providing clear insights and a unified investment tracking experience.
Why Do Users Need This App?
Why Do Users Need This App?
Understanding the Problem
Comprehension
Prioritization
Tracking
Confidence
Financial mistakes increase when data is misunderstood.
Trust decreases when users cannot understand portfolio performance.
Investment decisions become emotionally driven instead of informed.
Beginner investors abandon investment apps due to complexity.
Why does it matter?
Complex Financial Data
Information Overload
Fragmented Portfolio Tracking
Low Investment Confidence
Research → Insights → Opportunities
Undestanding user step by step


Students
First time Investors
Too many graphs, tabs, and numbers create confusion for beginners.
Users feel anxious while investing due to market volatility.
Users want quick understanding instead of deep financial metrics.
Clean interfaces make investing feel safer and easier.
Positive feedback and guided experiences improve confidence.

%
Missed investment opportunities
%
started ignoring important insights
%
Reduced understanding
%
complain about Tracking difficulty.
In person Interviews & observationa insights revealed a gap between data availability and user comprehension.
"8 of 10 users struggled to understand portfolio performance metrics."
"Developed personas representing beginner investors to guide design decisions throughout the project."


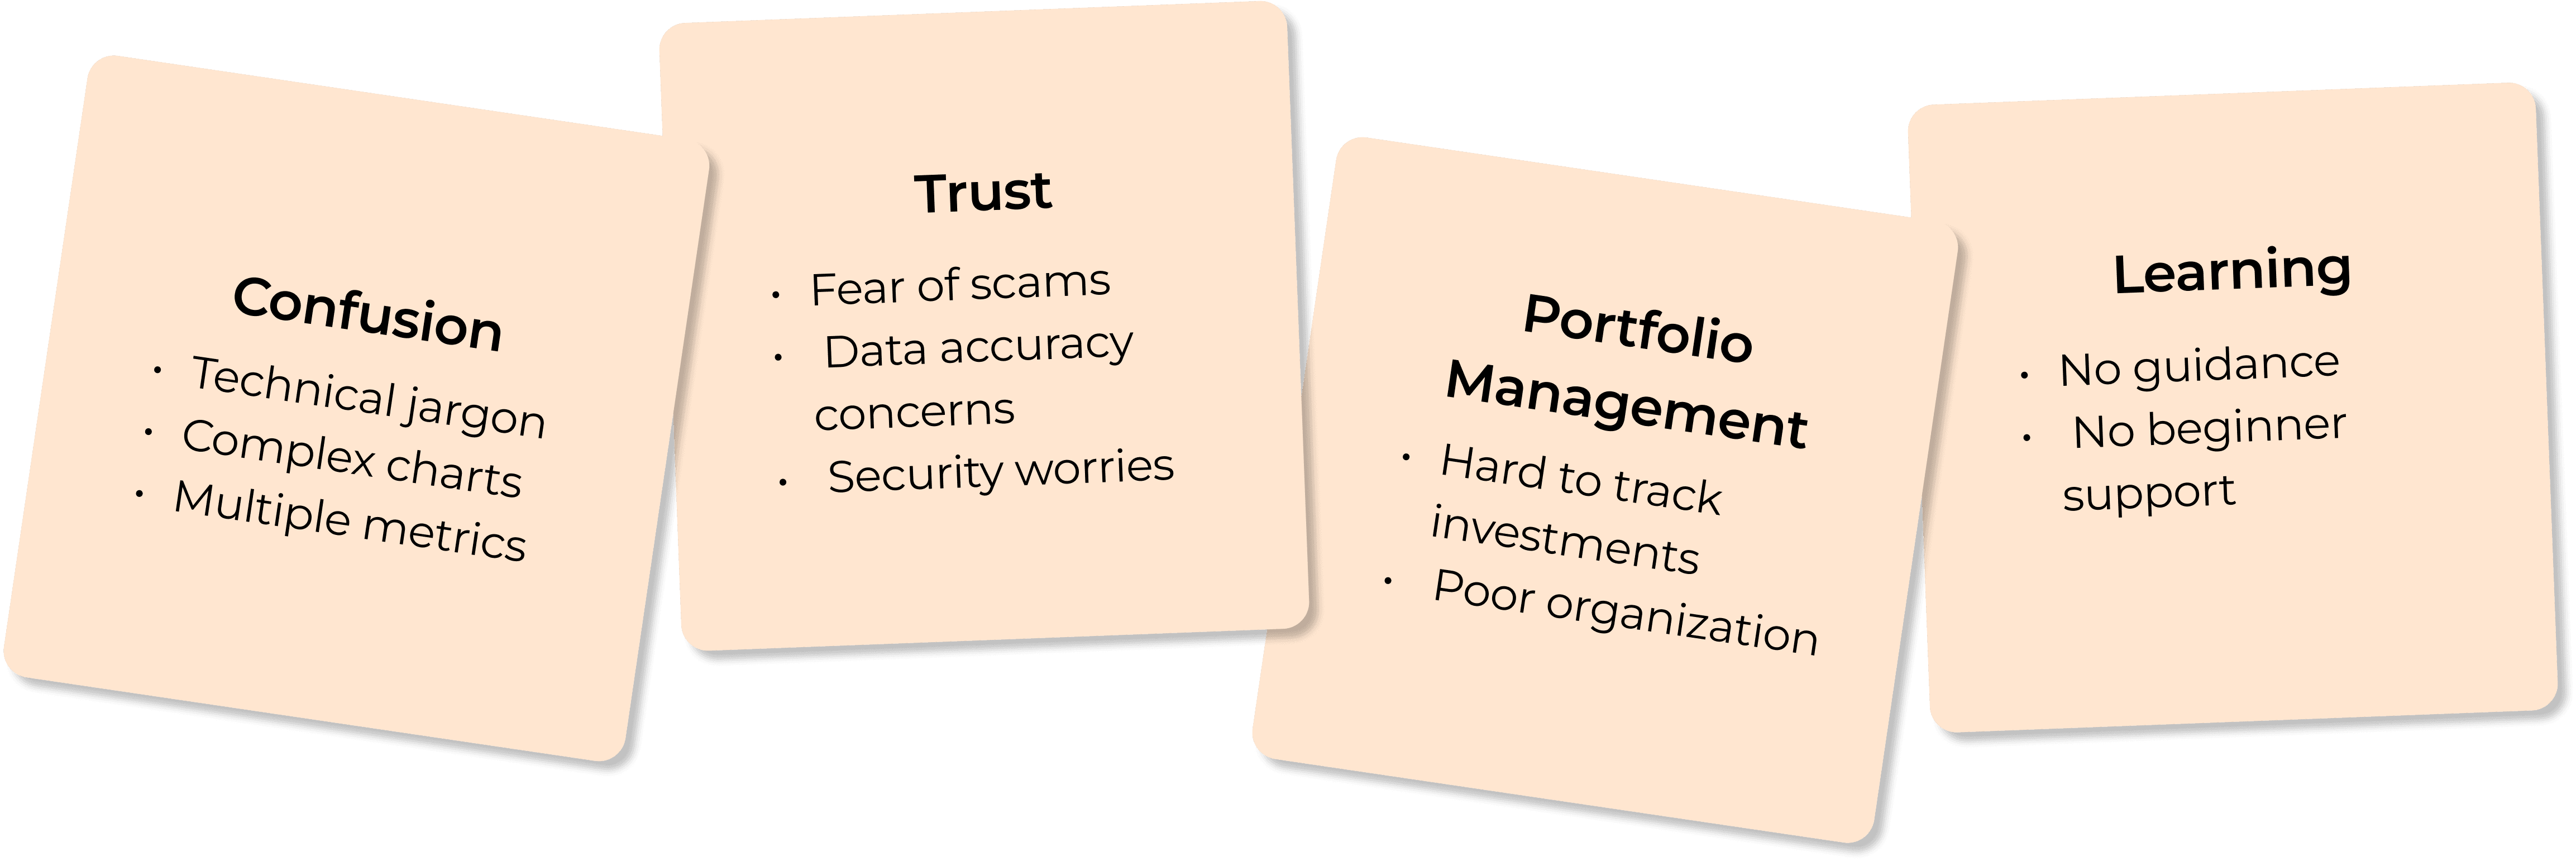

User Pain Points
Impacts
Step 01
Identifying target User
Step 02
Insights from Interviews and Observations
Step 03
Understanding Impact on User Experience
Step 04
Building User Persona
Step 05
Framing insights and user needs
Affinity Mapping
User Journey
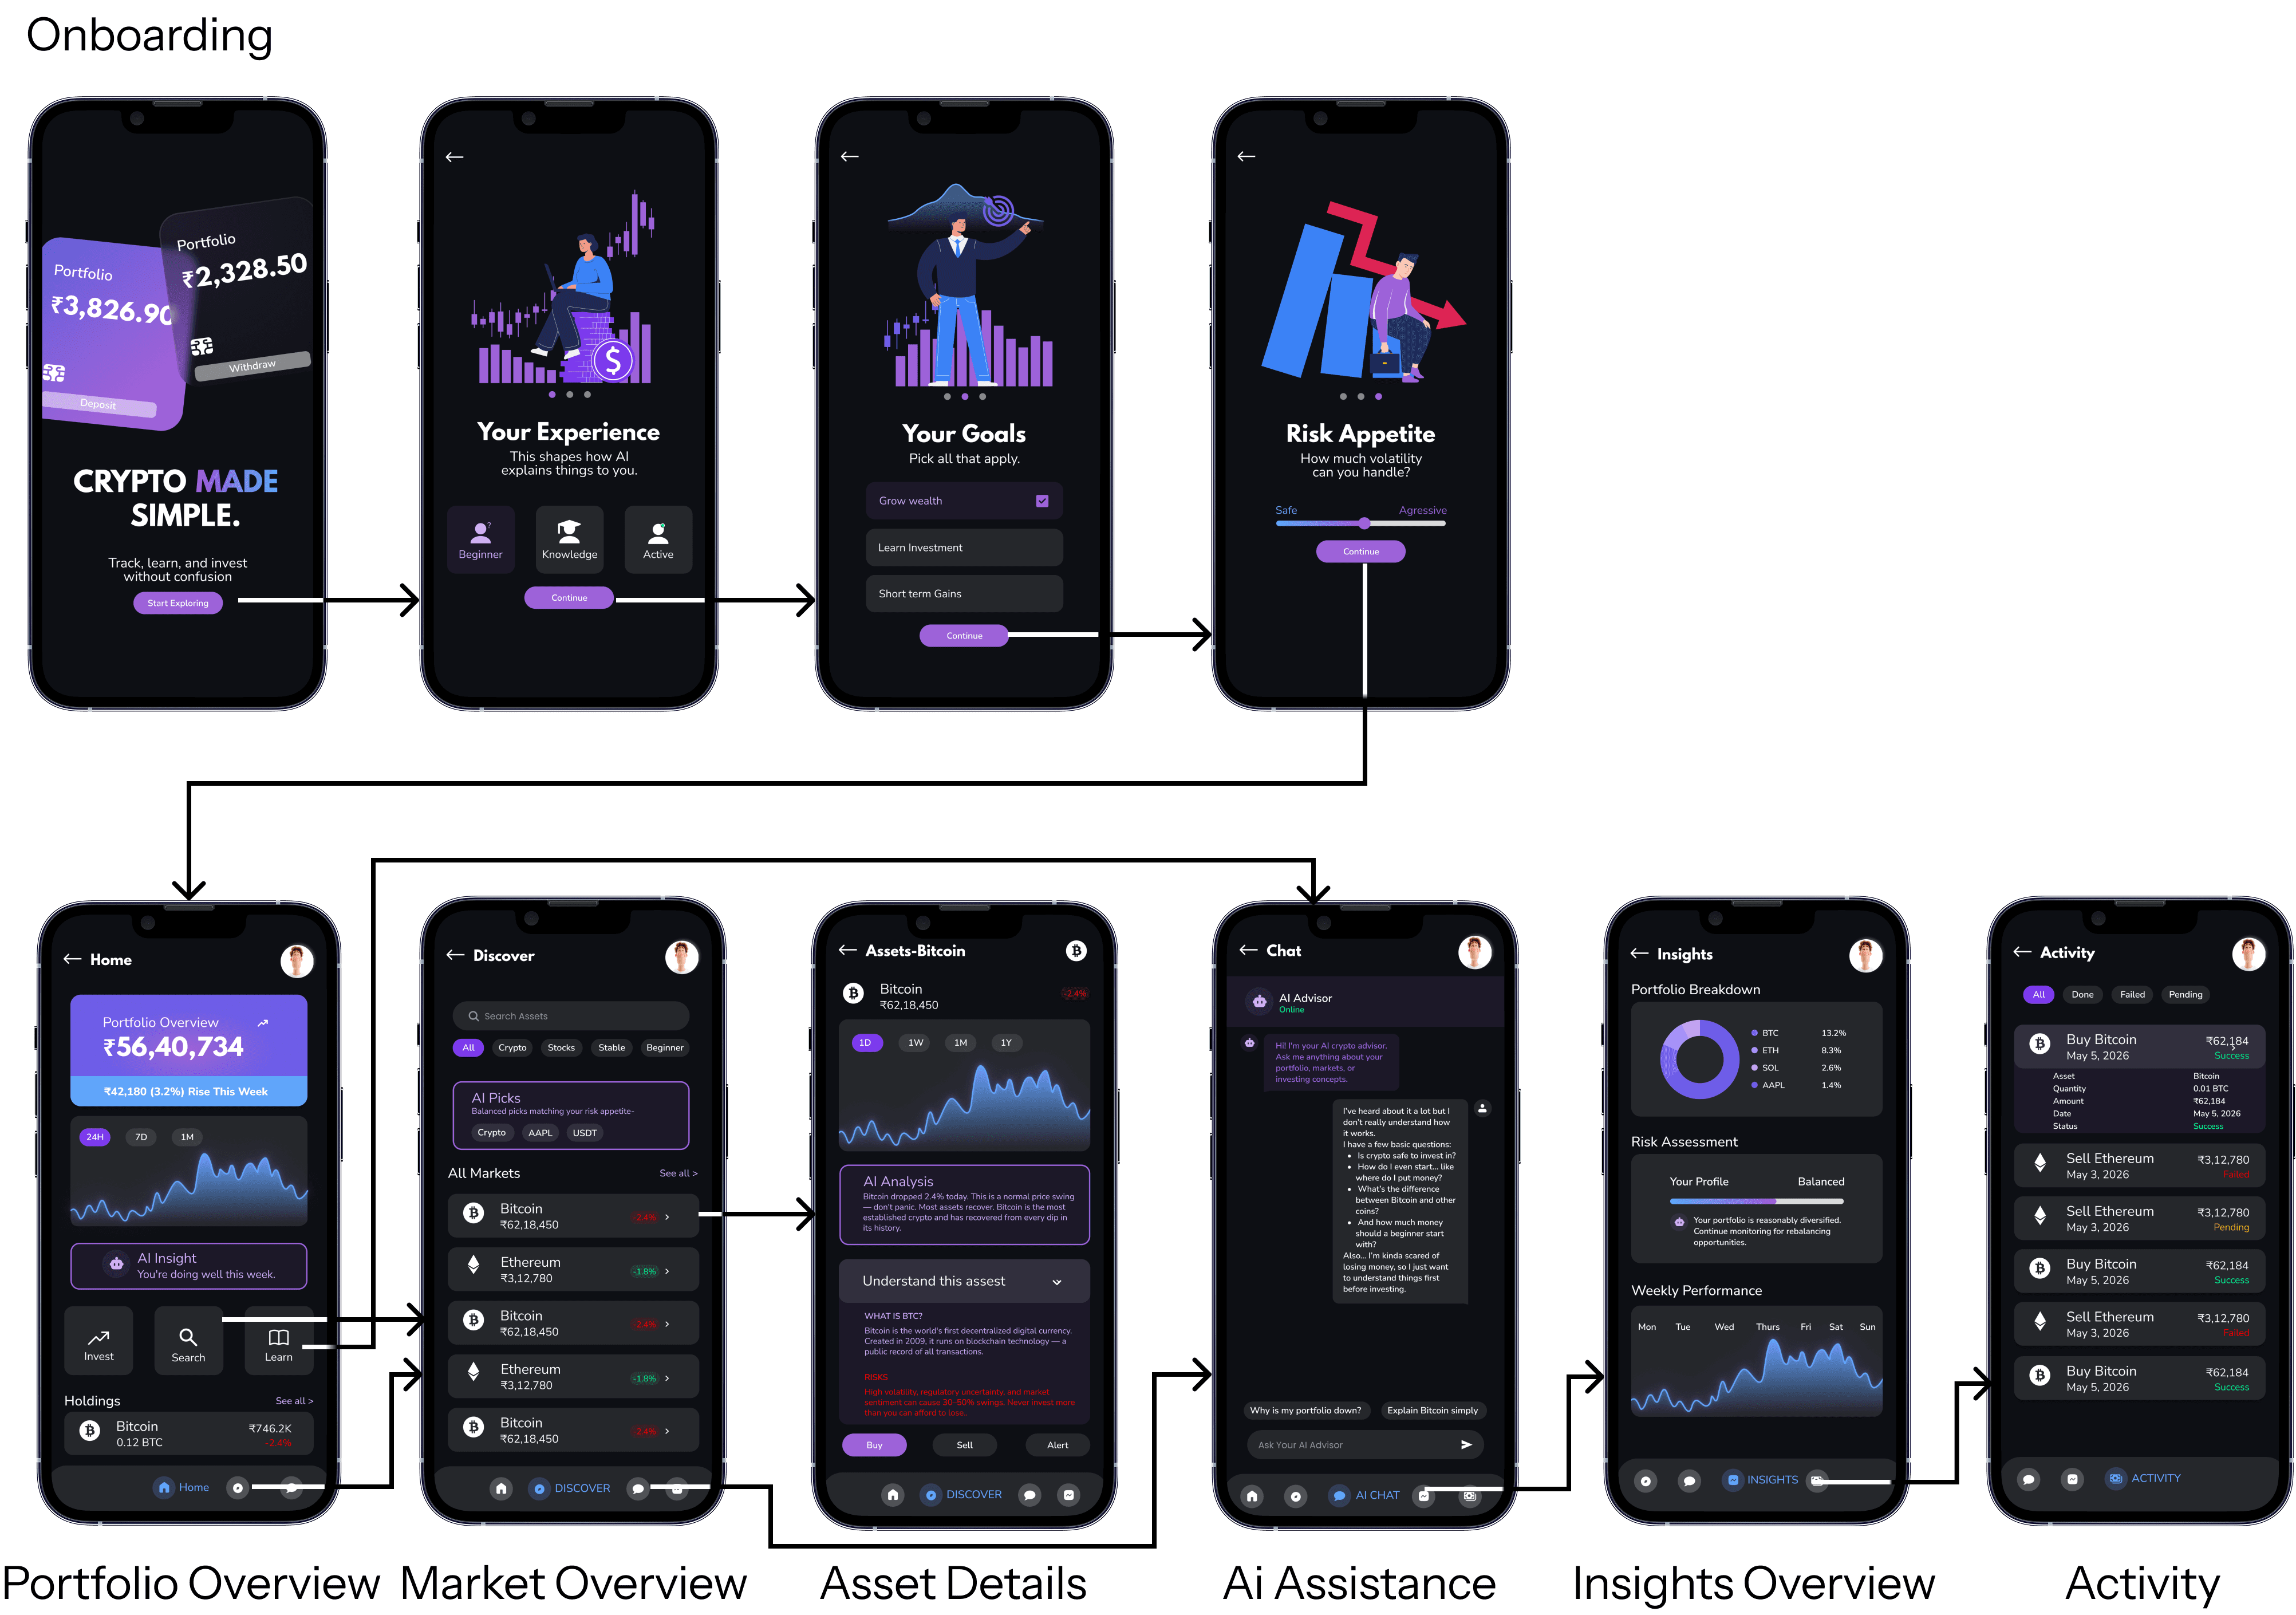
Simplified Portfolio Overview
Easy-to-Understand Financial Information
Actionable Investment Insights
Confidence in Decision-Making
Reduced Information Overload
How user insights were IMPLEMEnted into actionable design solutions?
Research to Design Opportunities

Expected Outcome:
Users can instantly understand portfolio performance without analyzing complex data.
Large portfolio value
Weekly growth indicator
AI-generated summaries
Portfolio Breakdown Visualization
Risk Assessment Dashboard

Expected Outcome: Users can discover suitable investment opportunities with confidence.
AI Picks Section
Categorized Asset Discovery
Transaction History With Categories
Status-Based Activity Tracking

Expected Outcome:
Users understand investment information without financial expertise.
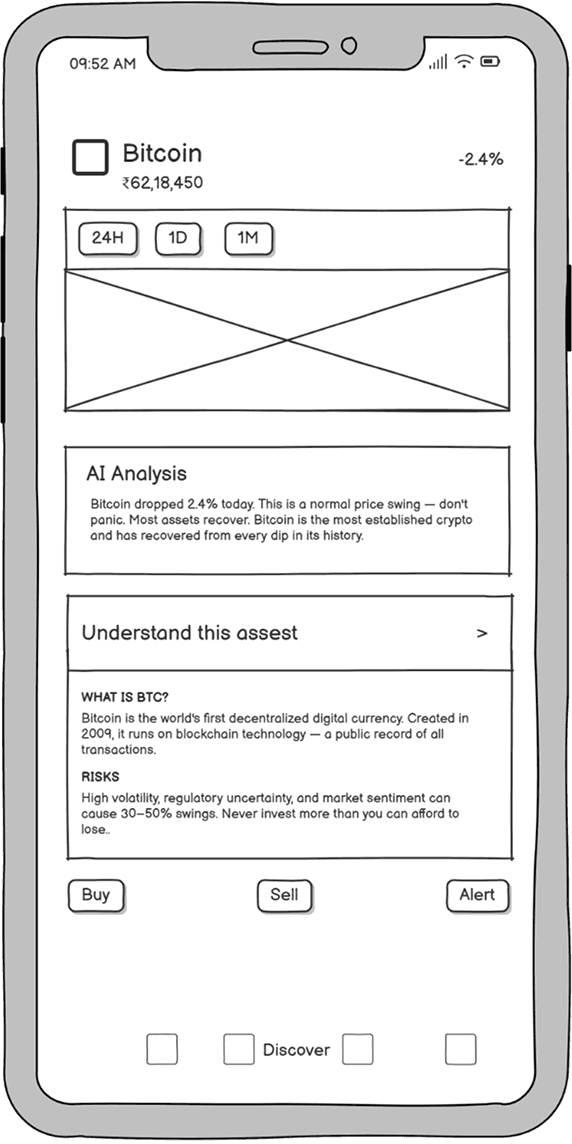
AI Analysis Card
Simplified Asset Explanations
A voice-enabled investment assistant.
Social Investing-
Allow users to explore portfolios and strategies from experienced investors.
A practice environment using virtual money.
Expected Outcome:
Complex financial data becomes easy to understand through visual summaries.

Expected Outcome: Users can easily monitor and verify all investment activities.
Goal Progress Tracker-
track progress toward investment milestones.
Tap any graph and receive a simple explanation.

(Some Ideas)
INFORMATION ARCHITECTURE
Visual Language
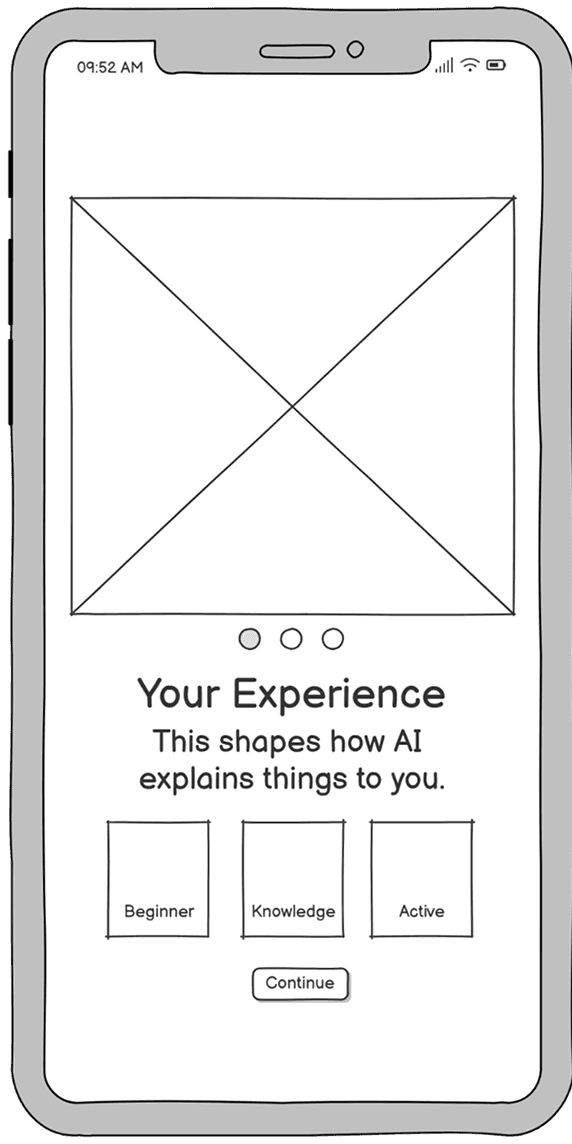
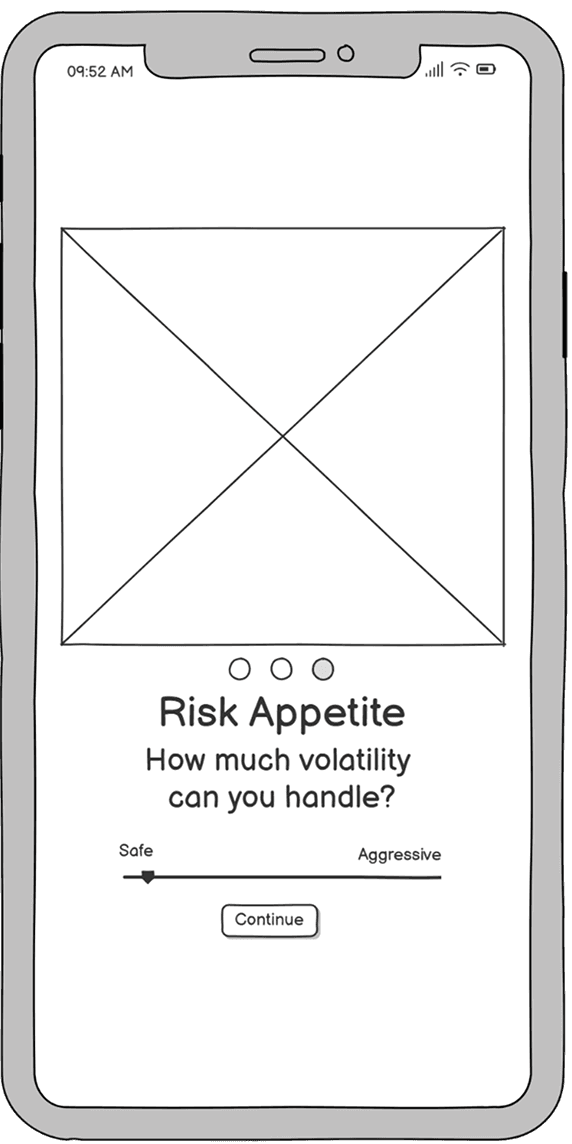
WIREFRAMES
Developing the concept







How This Project Shaped My Design Thinking?
LEARNINGS

Research is valuable only when translated into design decisions.
Simplicity is more impactful than adding more features.
Financial products should build confidence, not just display data.
AI can be used as a learning and guidance tool, not just a feature.
Personalized experiences help reduce anxiety and improve user engagement.
Clear communication and visual hierarchy are critical when designing data-heavy products.







IND
